Sales
Are you selling more—or charging more?
Compare orders and average order value to understand what changed.
Capstone Insights · For brand owners and growth teams
Your numbers live across sales, ads, customer, and search reports. Capstone Insights brings them into one dashboard so you can see what needs attention first. The fictional example shows sales trends and sellers pricing below MAP. Apply for your free trial below.
Your insights
We confirm your supported accounts, agree on access, and build the views your team needs.
We confirm which accounts we can connect and what history is available before setup.
See where each number comes from, what period it covers, and what it means.
Track what matters to your brand, without rebuilding the same report every week.
Review the evidence behind each issue, with dates and source details in reach.
We manage your agreed data connections and set a reporting refresh schedule for each source.
Includes two agreed dashboard changes each month to views or measures. Data refreshes follow your source schedule.
Accounts we can assess: Amazon selling and advertising accounts, Shopify, Google Analytics, Google Ads, Meta Ads, and relevant CRM or internal data. We confirm support, access, and available history before connecting an account.
Inside the Capstone dashboard
Switch report pages and tap the charts to inspect each month. This example uses invented data. No real brand performance figures are shown.
Amazon · United States · demo data
See what deserves attention first.
The period you picked at a glance
Fictional data onlyReported brand sales
$96,000Selected monthBrand orders
2,000Orders, not unitsBrand customers
1,667Purchasing customersRepeat purchase rate
20.0%Buyers with multiple ordersNew-to-brand customers
900Separate from one-order buyersAug 2026 · Illustrative brand report · not actual brand results
Your brand, month by month
March–August demo sales: $72,000 · $88,000 · $81,000 · $105,000 · $90,000 · $96,000.
Hover or touch to inspect. Arrow keys move through months; Enter selects a month.
Aug 2026 selected · fictional brand data · each latest check below has its own period
Your Brand · lubricants · latest checks
Products under MAP
3 of 8The price shoppers see is under our minimum price
Sellers undercutting
2Sellers offering a price under MAP
Share of units sold
10.0%#5 of 5 brands in our tracked set
| Period | Performance oil price |
|---|---|
| Sep 19 | $60 |
| Sep 20 | $58 |
| Sep 21 | $54 |
| Sep 22 | $48 |
Illustrative source: offers capture · Sep 22, 2026 · fictional data
Illustrative source: Keepa estimate · Sep 22, 2026 · fictional data
Illustrative source: DataDive · Sep 22, 2026 · fictional data
Amazon · United States · demo data
Separate sales momentum from price and volume changes.
Orders on our listings
2,000All sellers · Aug 2026
Listing revenue
$96,000All sellers · +20% vs Aug 2025
Average order value
$48Revenue ÷ orders
| Period | Listing revenue |
|---|---|
| Mar | $72,000 |
| Apr | $88,000 |
| May | $81,000 |
| Jun | $105,000 |
| Jul | $90,000 |
| Aug | $96,000 |
Illustrative source: Amazon Brand Analytics · Aug 2026 · fictional data
From $80,000 to $96,000 versus last August.
Prior: 1,600 orders × $50. Current: 2,000 × $48. Volume effect: 400 × $50 = $20,000; order-value effect: 2,000 × −$2 = −$4,000. Revenue excludes returns, tax and costs; this is not profit.
Illustrative source: Amazon Brand Analytics · Aug 2026 · fictional data
Illustrative source: Amazon Brand Analytics · Aug 2026 · fictional data
| Week ending | Orders |
|---|---|
| Aug 9 | 440 |
| Aug 16 | 480 |
| Aug 23 | 500 |
| Aug 30 | 580 |
Four complete sample weeks; weekly reporting has its own period.
Illustrative source: weekly listing report · Aug 2026 · fictional data
| Product | Revenue change vs July |
|---|---|
| Performance oil | +18% |
| Motorcycle oil | +12% |
| Gear oil | −6% |
Illustrative source: listing history · Aug vs Jul 2026 · fictional data
Amazon · United States · demo data
Understand repeat buying and the next partnership opportunity.
Purchasing customers
1,667Aug 2026
Repeat customers
33320.0% of purchasing customers
Repeat customer revenue
$31,968666 orders × $48
One-order customers are not necessarily new-to-brand. In this demo each repeat customer places two orders.
Illustrative source: Amazon Brand Analytics · Aug 2026 · fictional data
Illustrative source: customer loyalty export · week ending Aug 30, 2026 · fictional data
| Partner brand | Co-purchase rate |
|---|---|
| Companion A | 8.0% |
| Companion B | 6.0% |
| Companion C | 4.5% |
| Companion D | 3.0% |
| Companion E | 2.5% |
Illustrative source: market basket export · Aug 2026 · fictional data
Illustrative source: market basket export · Aug 2026 · fictional data
| Shopper group | Customers |
|---|---|
| Awareness | 22,000 |
| Consideration | 4,800 |
| Purchasing | 1,667 |
| New-to-brand purchasing | 900 |
Each stage is a separate shopper group, not a sequential conversion funnel.
Illustrative source: brand customer export · Aug 2026 · fictional data
| Age group | Share of purchasers |
|---|---|
| 18–24 | 8% |
| 25–34 | 28% |
| 35–44 | 32% |
| 45–54 | 20% |
| 55+ | 12% |
Illustrative source: brand demographics export · Aug 2026 · fictional data
Amazon · United States · demo data
Find the searches where shoppers are choosing someone else.
Tracked terms on page 1
16 of 4040.0% · latest captured ranks
Monthly searches we track
120,000Across 40 fixed phrases
Purchase share
12.0%600 of 5,000 purchases on tracked queries
Illustrative source: DataDive · search-volume-weighted spots · fictional data
| Search phrase | Monthly searches | Best rank |
|---|---|---|
| synthetic engine oil | 12,000 | 18 |
| motorcycle engine oil | 8,400 | 24 |
| gear lubricant | 5,200 | 31 |
Illustrative source: DataDive · Sep 22, 2026 · fictional data
| Search phrase | Purchases | Your share |
|---|---|---|
| synthetic engine oil | 1,500 | 6.0% |
| lubricants set | 1,200 | 8.0% |
| gear lubricants | 900 | 10.0% |
Illustrative source: search query export · Aug 2026 · fictional data
| Week ending | Tracked terms in top 10 | Coverage |
|---|---|---|
| Aug 9 | 14 of 40 | 35.0% |
| Aug 16 | 15 of 40 | 37.5% |
| Aug 23 | 16 of 40 | 40.0% |
| Aug 30 | 16 of 40 | 40.0% |
Coverage across 40 fixed terms. Visibility is separate from unit share and purchases.
Illustrative source: DataDive · sample complete weeks · fictional data
Amazon · United States · demo data
Compare your position within a clearly defined competitive set.
Share of units sold
10.0%2,000 of 20,000 estimated units
Tracked brands
5Your Brand + four fictional competitors
Tracked products
408 per brand · fixed demo set
Illustrative source: Keepa estimate · Sep 22, 2026 · fictional data
Share is measured within our tracked product set: Your Brand’s 2,000 units divided by 20,000 units across five brands.
This is not whole-category market share. Estimated competitive units are separate from recorded listing orders.
Illustrative source: Capstone tracked product list · fictional data
Competitor A has the largest unit share. Compare its page-1 visibility, listing strength, and price position before deciding where to compete.
Inspect search visibility →Illustrative comparison · not a growth forecast · fictional data
Amazon · United States · demo data
See which product pages need work, then inspect the evidence.
Captured title: Your Brand Performance oil for vehicle maintenance
Evidence: Use-case information is absent from bullets; two images against a top-10 median of seven.
Listing quality is a comparative content score, not a sales forecast. Proposed edits remain in the portal until separately approved for publication.
Captured title: Your Brand Motorcycle oil for vehicle maintenance
Evidence: Pack size appears in the description, but is absent from the title.
Listing quality is a comparative content score, not a sales forecast. Proposed edits remain in the portal until separately approved for publication.
Captured title: Your Brand Gear oil for vehicle maintenance
Evidence: Above the family median; inspect customer reviews before changing copy.
Listing quality is a comparative content score, not a sales forecast. Proposed edits remain in the portal until separately approved for publication.
Illustrative source: DataDive and captured listing copy · Sep 22, 2026 · fictional data
Average rating
4.4 / 5Across the demo product set
Total reviews
1,280Captured review counts
Illustrative source: Keepa listing capture · Sep 22, 2026 · fictional data
Amazon · United States · demo data
Find price cuts, affected products, and the sellers behind them.
Products under MAP
3 of 8Products with a minimum advertised price
Sellers undercutting
2Unique sellers in the demo capture
Deepest cut
20%Performance oil · $48 vs $60 MAP
| Product | Shopper price | MAP | Status |
|---|---|---|---|
| Performance oil | $48.00 | $60.00 | 20% below MAP |
| Motorcycle oil | $34.20 | $38.00 | 10% below MAP |
| Gear oil | $27.00 | $30.00 | 10% below MAP |
| Chain cleaner | $32.00 | $32.00 | At MAP |
| Brake fluid | $26.00 | $25.00 | Above MAP |
| Coolant | $24.00 | $24.00 | At MAP |
| Engine cleaner | $42.00 | $40.00 | Above MAP |
| Chain lubricant | $18.00 | $18.00 | At MAP |
Illustrative source: offers capture · Sep 22, 2026, 12:00 UTC · fictional data
| Product | Offer | MAP |
|---|---|---|
| Performance oil | $48.00 | $60.00 |
| Motorcycle oil | $34.20 | $38.00 |
Demo seller identity · item price, shipping excluded.
| Product | Offer | MAP |
|---|---|---|
| Gear oil | $27.00 | $30.00 |
Illustrative source: offers capture · Sep 22, 2026 · fictional data
| Period | Shopper price |
|---|---|
| Sep 19 | $60 |
| Sep 20 | $58 |
| Sep 21 | $54 |
| Sep 22 | $48 |
Illustrative source: captured daily prices · fictional data
Amazon · United States · demo data
Know what is connected, what is current, and what is missing.
| Source | Covers | Updated |
|---|---|---|
| Amazon listing sales | Aug 2026 | Sep 7, 2026 |
| Customers & loyalty | Aug 2026 | Sep 7, 2026 |
| Search queries | Aug 2026 | Sep 8, 2026 |
| Competitor estimates | Latest capture | Sep 22, 2026 |
| Search ranks | Latest capture | Sep 22, 2026 |
| Prices & sellers | Latest capture | Sep 22, 2026 |
| Advertising performance | Not supplied | Unavailable |
Illustrative source status · no accounts connected · fictional data
Monthly sales and customer reporting cover August. Prices, search ranks, and competitive estimates describe September captures. A newer price check does not make the monthly sales report newer.
Missing advertising data stays unavailable; it is never shown as zero.
Illustrative coverage disclosure · fictional data
Your authorized operator manages eligible integrations and source permissions. A connected account does not prove that its report data is current.
Your trial starts with one agreed source. Available pages depend on the sources and permissions in your brand’s scope.
Source availability agreed during onboarding · fictional data
Amazon · United States · demo data
Scope deeper research with your operator before running it.
Explore product demand, search opportunities, and competitor questions with your authorized operator.
Research tools require operator access. Paid execution needs explicitly scoped credentials and a daily dollar limit.
Capability preview · permissions and source access required · fictional data
Your Brand: August review. Listing revenue was $96,000 from 2,000 orders. 333 of 1,667 customers bought more than once. Latest September checks show 3 of 8 products under MAP; those checks are separate from August reporting.
Next review: price protection, three missed searches, and the Performance oil’s listing content.
“Where should I start?”
Check the Performance oil first: its latest shopper price is $48 versus a $60 MAP, a 20% cut. Inspect the sellers and captured offer date in Prices & sellers. Then review its listing-quality evidence.
This is a written example of a report-grounded answer; the public demo does not run an AI query.
All figures, product examples, competitor names, sellers, and dates are invented; none represent any real brand’s performance. This is a representative walkthrough, not a complete connected workspace. Monthly sales are listing totals across all sellers. Repeat customers have more than one order; one-order customers are not necessarily new-to-brand. Market share is an estimate within a fixed tracked set, not whole-category market share. MAP means minimum advertised price.
Real pages depend on eligible sources, coverage and role permissions. Data connection controls and research execution require authorized operator access. No demo action publishes a listing, changes an ad, or spends money.
Picture this with your brand’s data.
Start with one supported account and a question you want answered.
Apply for your free trialGrowth questions
Sales
Compare orders and average order value to understand what changed.
Orders
See product sales and order trends to find your strongest performers.
Customers
See how often customers buy again and how repeat buying changes over time.
Competitors
Compare sales, prices, and visibility within a clearly defined set of competitors.
Search
See where you appear in search and which tracked terms need attention.
Priorities
Bring the signals together to choose what to investigate next. Missing data stays clearly marked.
How it works
01
Choose one question you want answered. We check which account can help and agree on access.
02
We help connect one supported data source and build a useful dashboard view with you.
03
See what the numbers show. Then decide together whether a fuller dashboard makes sense.
Why Capstone
| Without a shared dashboard | With Capstone Insights |
|---|---|
| Conflicting numbers | Clear sources, dates, and definitions |
| Generic reporting | Reporting around your brand’s questions |
| Reports that never change | Two agreed changes to views or measures each month |
| Unclear competitor comparisons | Competitor comparisons with clear boundaries |
Ways to work together
Use Capstone Insights on its own. If you also want an Amazon retail partner, explore our optional Brand Partnership.
Start with insights
Your reporting workspace
A dashboard your team can use to make decisions.
One-time setup fee+ revenue share
Start with a free trial using one supported account. Your setup fee, revenue share, and included work are agreed before you commit.
Apply for your free trialOptional Amazon retail partnership
Build your Amazon channel together.
Insights included freeCapstone Insights is completely free for brand partners
We purchase inventory at agreed wholesale terms and work with you on the Amazon channel. Capstone Insights is completely free for our brand partners.
Tell us about your brandPartnership examples
Brand partners can also work with us on Amazon channel operations and product presentation. This work is scoped separately from standalone Insights.
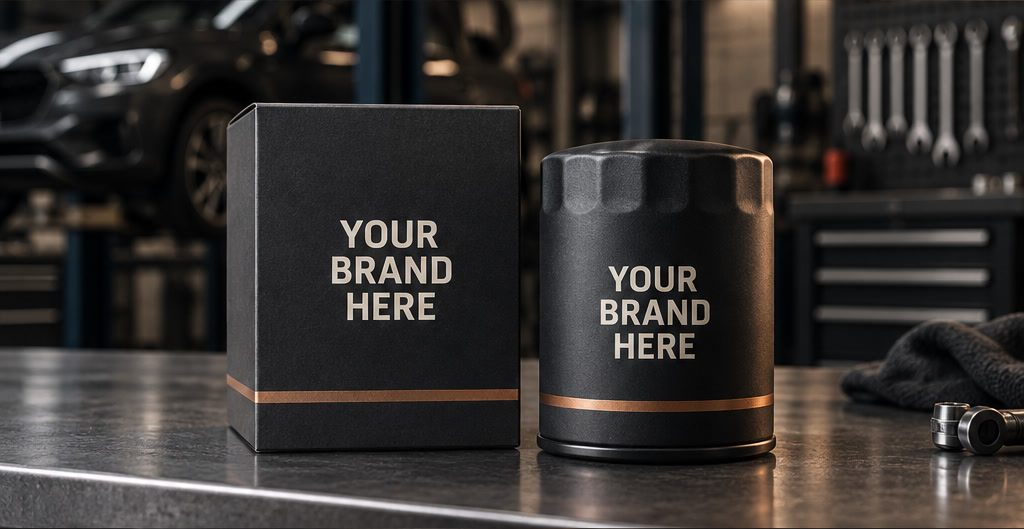
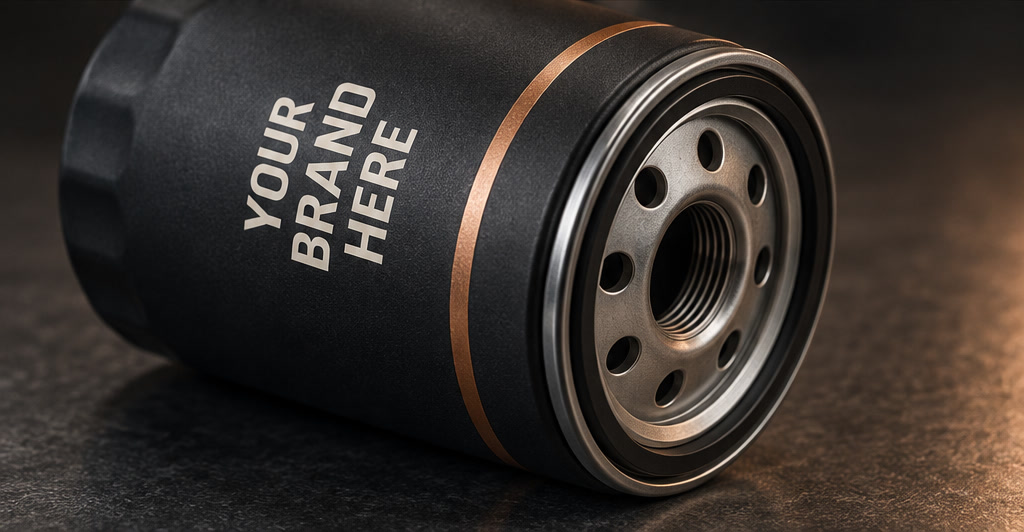
Automotive · Fictional concept
From the product shot to the packaging and supporting detail. A consistent visual identity, built around what you sell.
Discuss your brand’s next step“Your Brand Here” is a fictional oil-filter concept, not a customer testimonial or fitment claim.

FAQ
A custom dashboard for brand owners and growth teams. We connect supported business accounts so you can see sales, customers, search visibility, and pricing in one place. Brand Partnership is a separate option for working with us on your Amazon channel.
Standalone Capstone Insights has a one-time setup fee plus revenue share, with two custom-dashboard updates each month. We agree on fees, revenue share, and scope before you commit. Capstone Insights is completely free for our brand partners.
A change to the views or measures in your dashboard. Two custom-dashboard updates each month are included with standalone Insights. We agree on the work and timing first. New accounts or larger projects may need a separate agreement. For example, we might add a product view or adjust a sales measure. Data refreshes follow the agreed schedule for each source and are separate from these changes.
We check each account before setup: what it supports, what data is available, and what access you can authorize. Some connections need separate custom work.
Insights helps you spot and evaluate opportunities. Results depend on the decisions you make and market conditions. Market-share comparisons need suitable competitor or category data, beyond your own sales.
No. You can use Capstone Insights on its own. Brand Partnership is a separate option, with its own wholesale agreement.
We review your trial dashboard together. If more reporting would help, we discuss the setup fee, revenue share, and included work. You are not automatically enrolled in a paid plan.
We agree on account access and data handling before connecting anything, including how to export or delete data when the work ends. The website demo uses fictional data and never connects to your accounts.
Founders
Meet Dan and Nick, the founders of Capstone. Talk directly with us about your brand and what you want to understand.


Free trial
Apply for your free dashboard trial. We’ll review your application, confirm a supported account, and build a view around one question that matters to your brand.
Standalone Insights uses a one-time setup fee plus revenue share. Capstone Insights is completely free for brand partners.
We agree on paid terms before you commit. The trial does not enroll you in a paid plan.
After you apply
We review your application and contact you to discuss your brand and plan the trial.
We’ve saved your application for review. We’ll contact you to discuss your brand and plan the trial. Applying does not create a paid plan or workspace access.
Your reference:
Questions? Email dan.bathon@capstonebrands.ai and include your reference.
See your brand’s performance in one place. Start with a free trial.